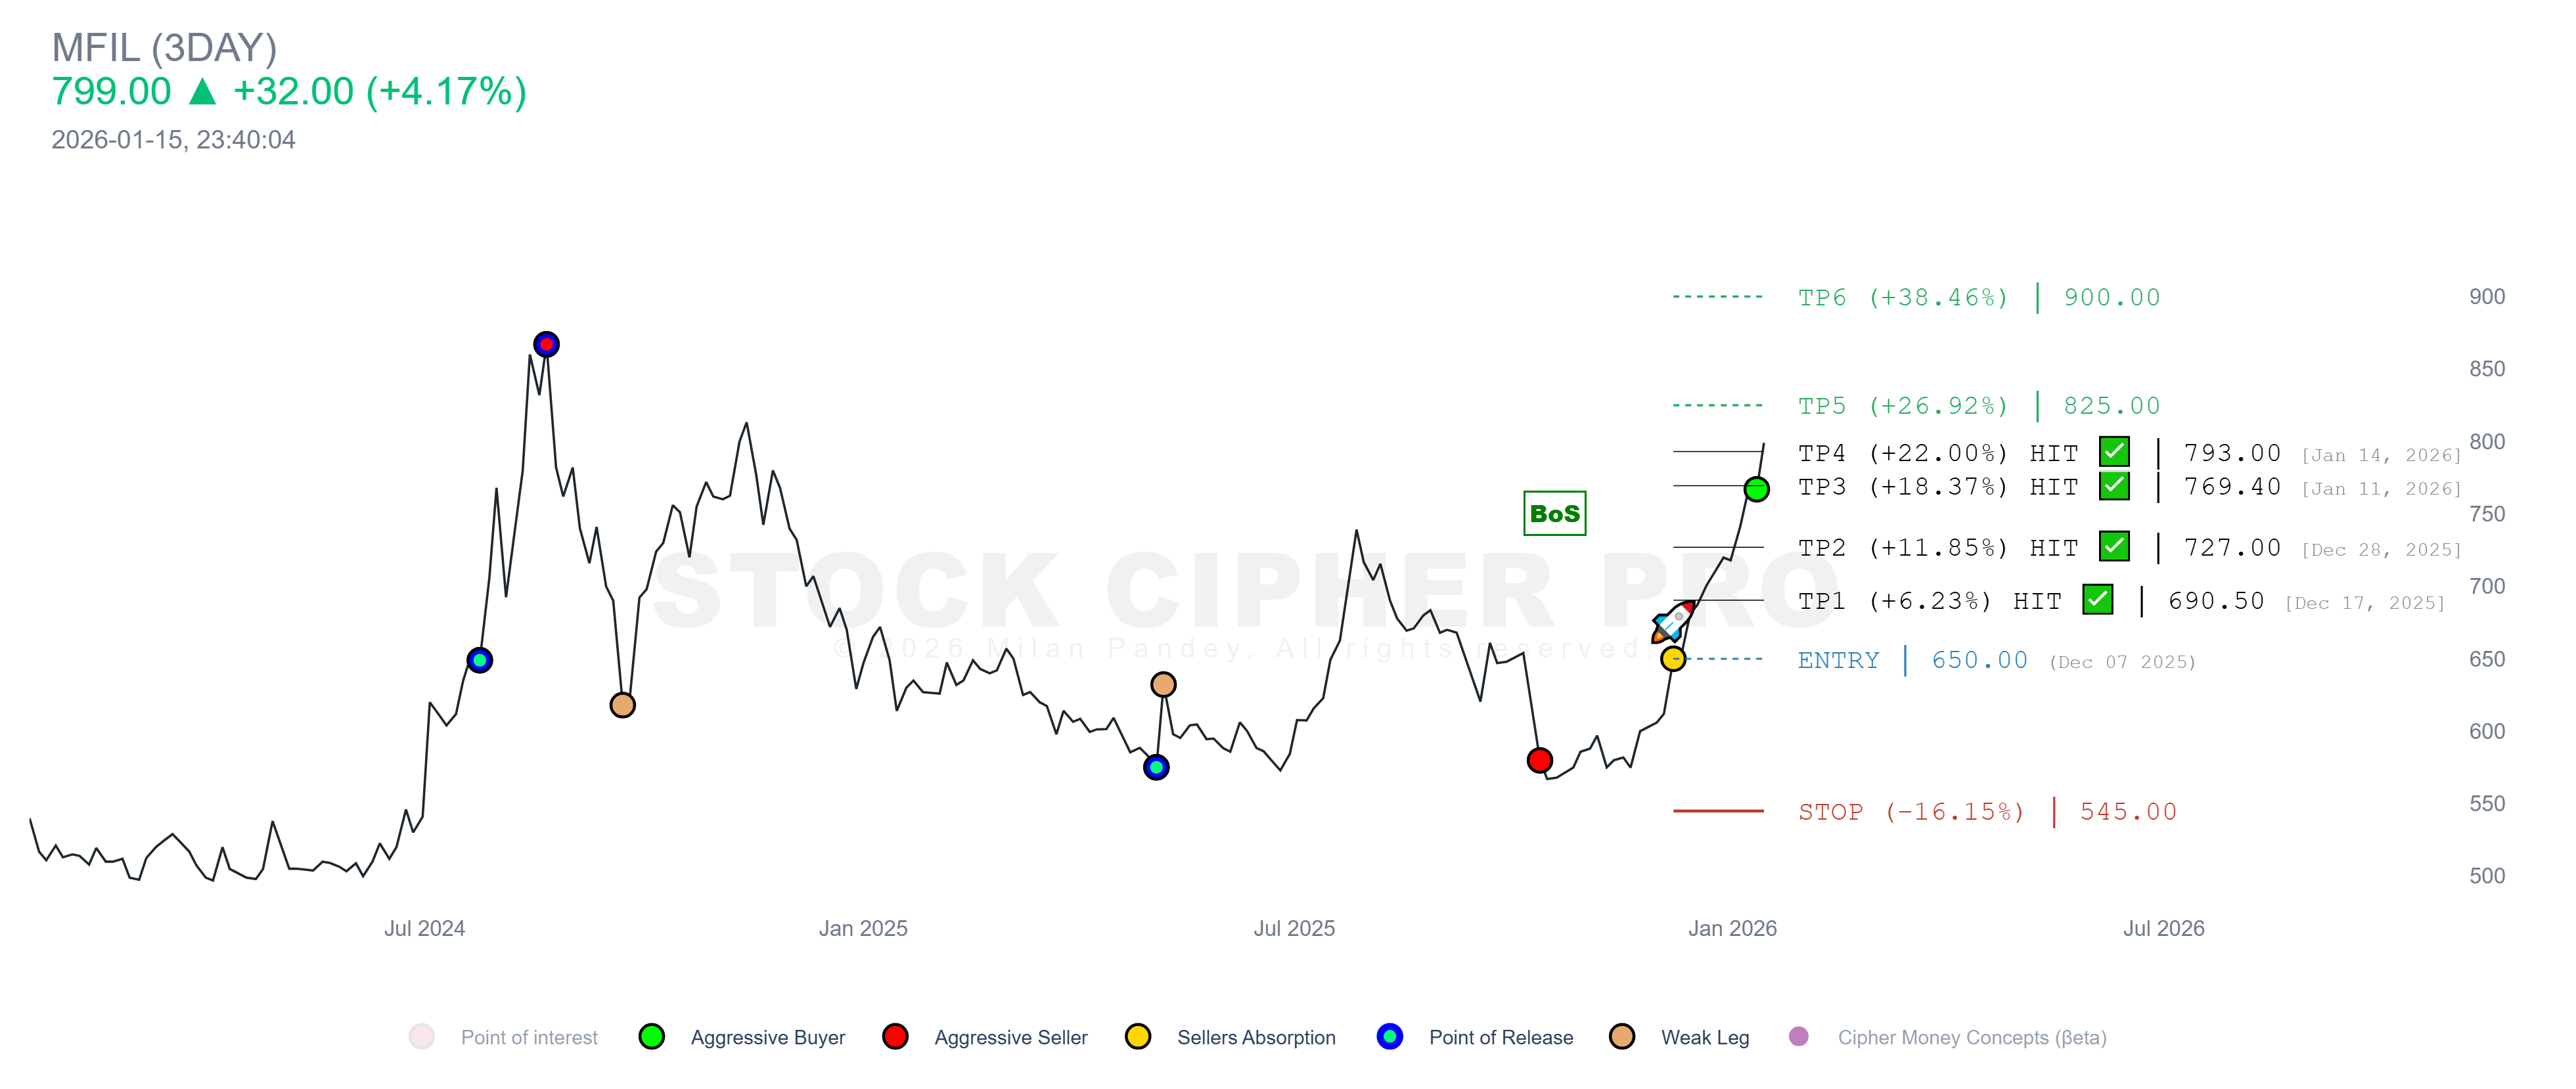
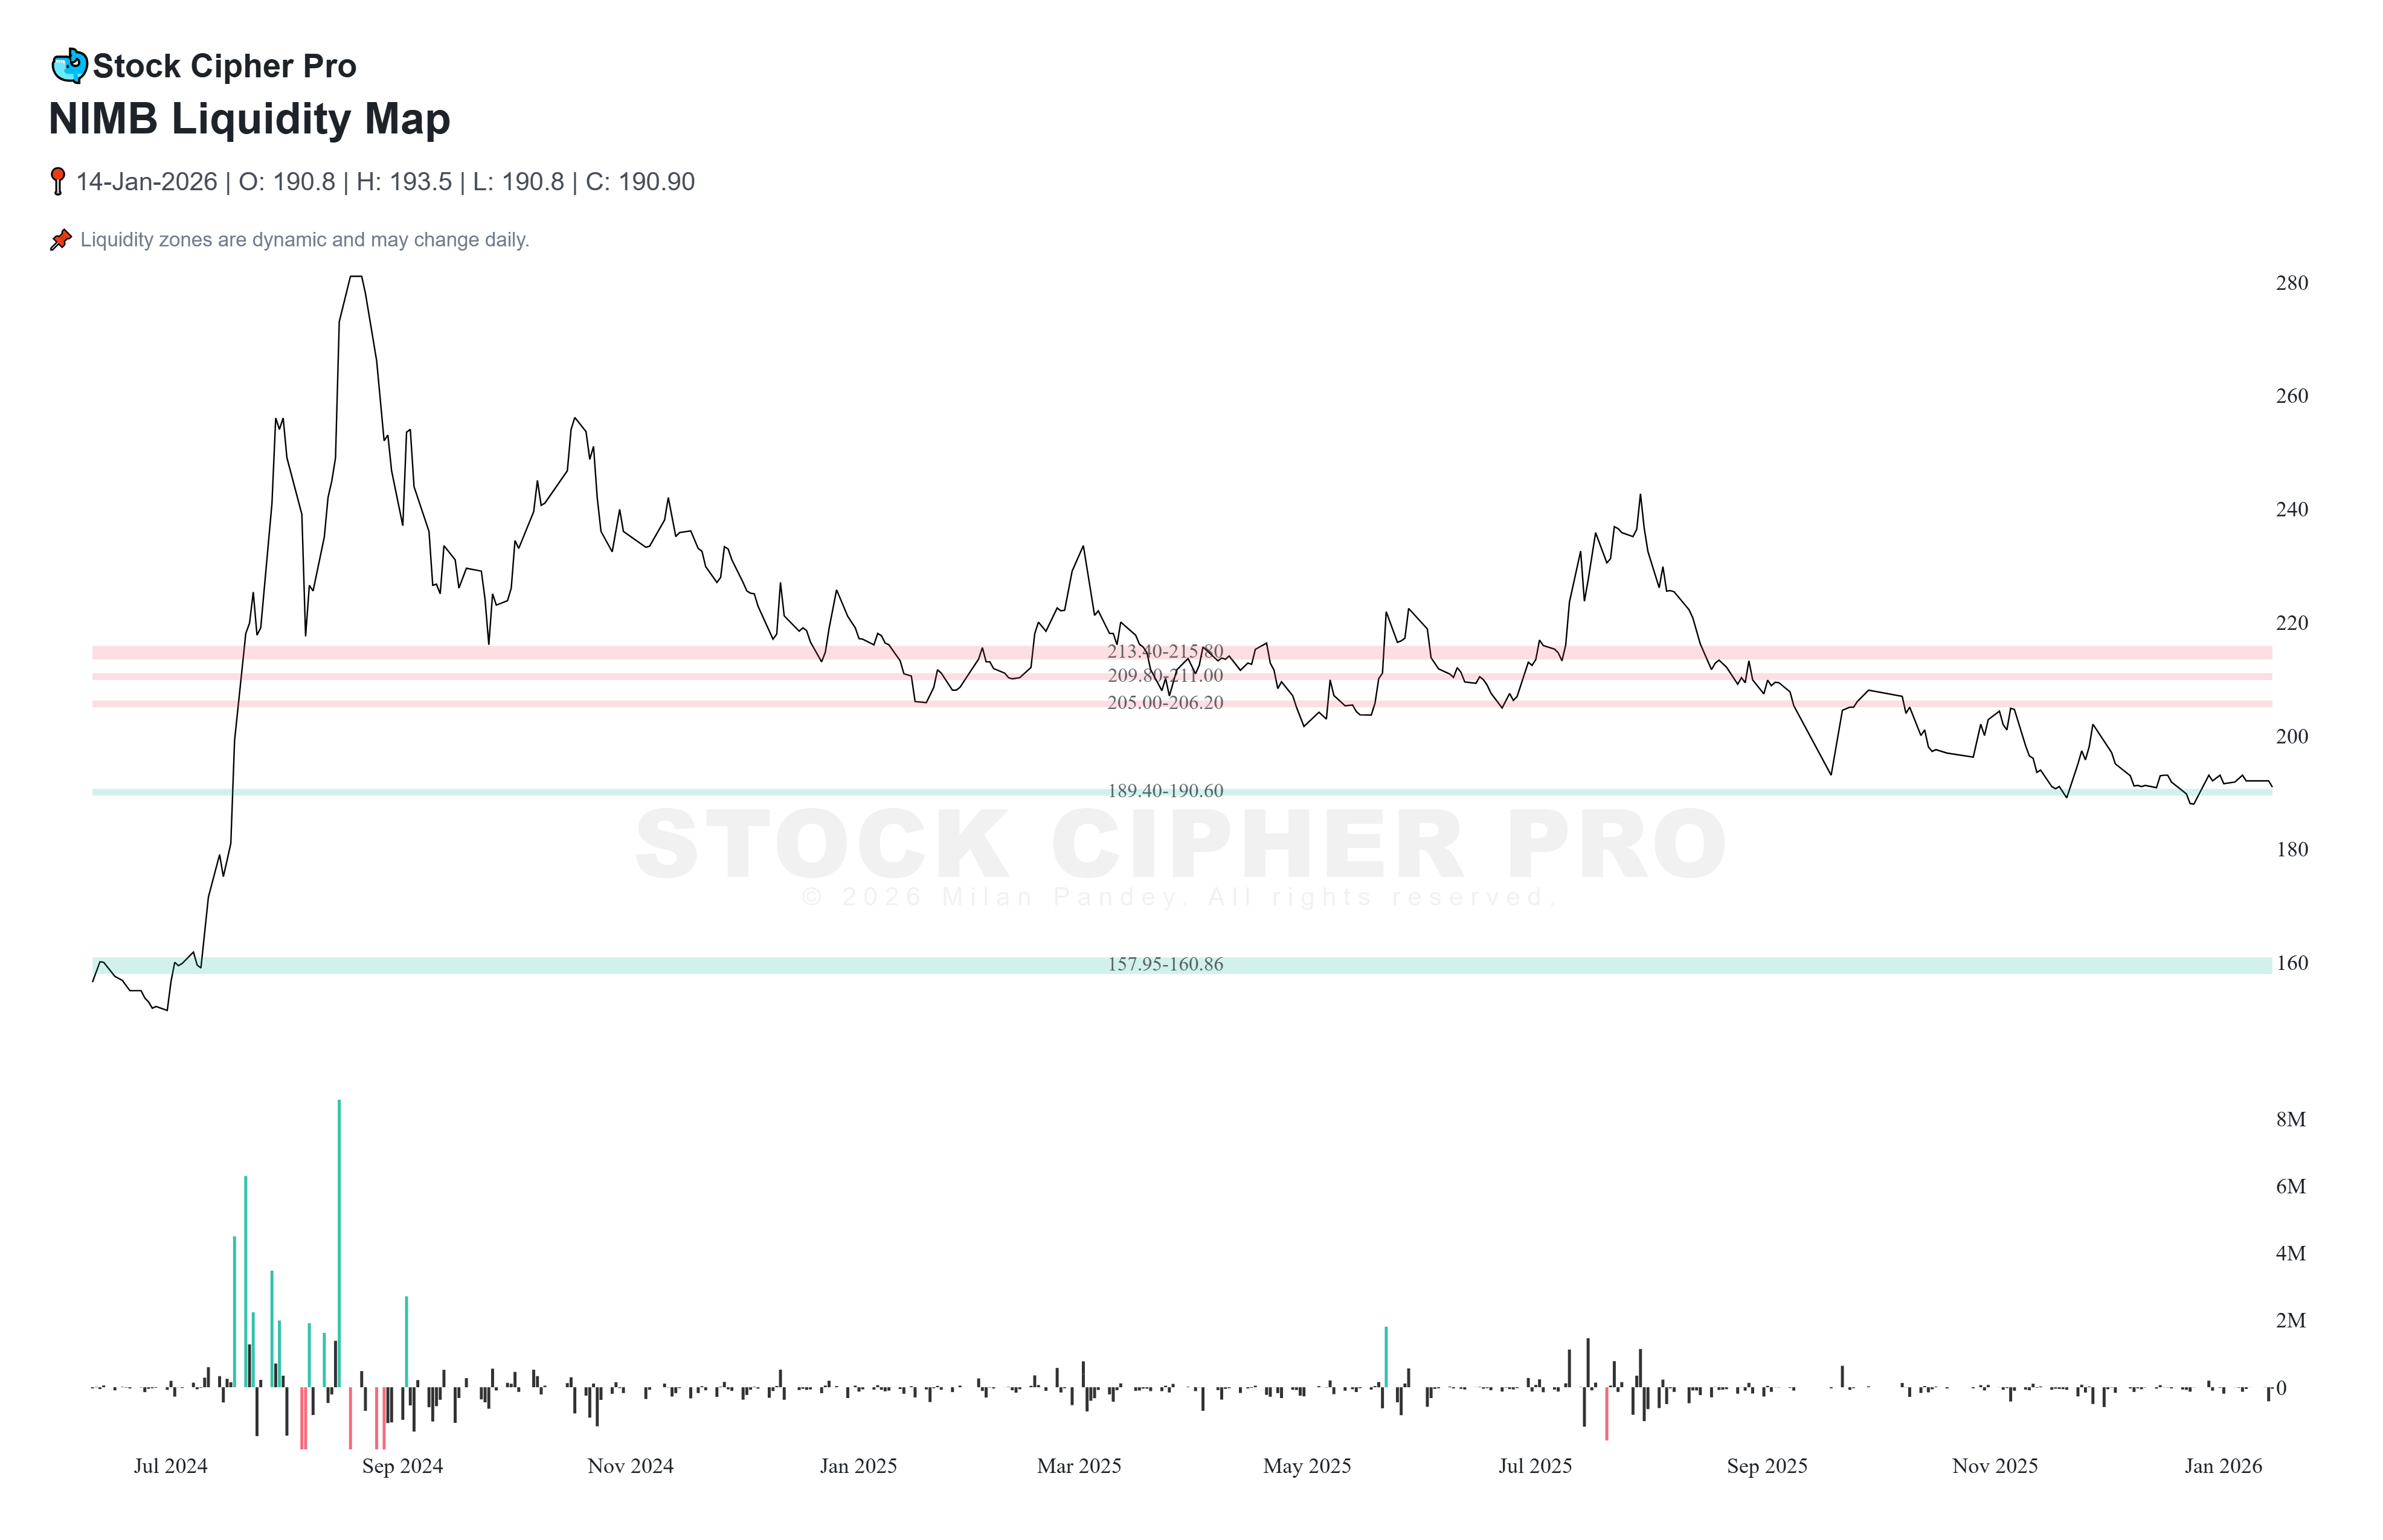
Step beyond conventional lagging indicators like RSI, MACD, Moving Averages, Bollinger Bands, and trendlines. Stock Cipher reveals true market structure through advanced Volume Profile, Price Action, and institutional footprint analysis.
The ultimate institutional edge engineered specifically for market analysis.
Pinpoints historical buy-side and sell-side liquidity concentrations, outlining areas where market participation maps out structural zones.
Delivers deep volume structural data highlighting momentum flip zones far beyond ordinary volume bars.
Isolates low-volume price movements and trap structures where retail participants typically experience false breakouts.
Maps major supply and demand zones which serve as key structural areas for tracking price behavior.
Highlights intense distribution and selling pressure zones to track institutional selling footprints.
Identifies heavy smart money accumulation footprints where buying momentum shifts direction.
Outlines precise algorithmic data regions where market participants locate logical structural entry and exit parameters.